
The correct way to fill out your control sample charts for internal QC
- 5 Minutes to read
- Written by Axonlab
- General Practice
A step-by-step instruction for internal quality control
1. First make sure you know the target value for the control sample in question.
This information is provided by the manufacturer. Many manufacturers include charts in the packaging, while others will have this information printed on the outside of the package. In still other cases, you will have to measure the control sample first and read the target value from the instrument display.
2. Look up the tolerance range specified by QUALAB.
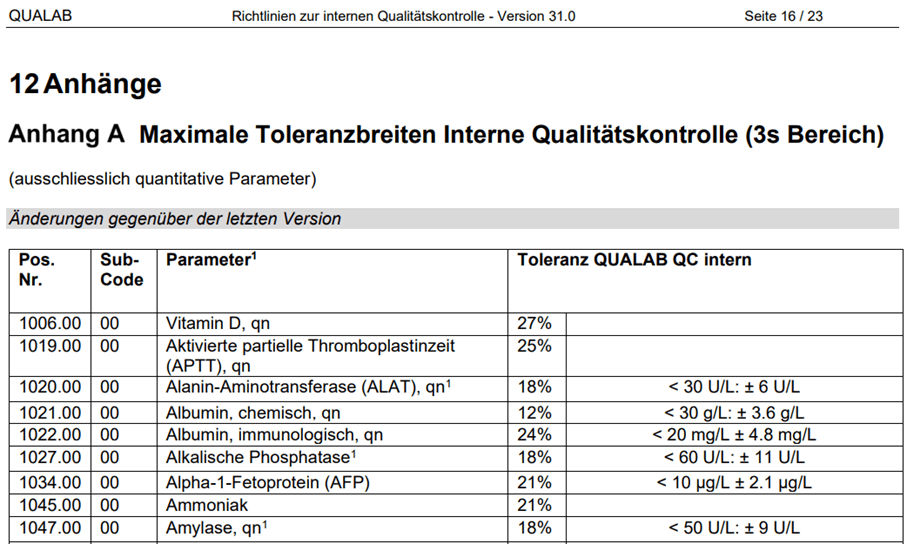
Go to the “Interne Qualitätskontrolle” [Internal quality control] menu on the QUALAB.swiss website and select “Aktuelle Richtlinien” [Current guidelines]. Open the PDF and scroll down to Appendix A at the very end of the document, where you can search for your analysis. To the right you will see the tolerance indicated as a percent, along with additional information. In the example below, you can see that the tolerance for ALAT is given as 18%. If your target value is < 30 U/L, however, you must use +/- 6 U/L as the tolerance range.
3. Now look to see which tolerance range is narrower – the manufacturer’s range or QUALAB’s.
Always use the narrowest range. If the control sample manufacturer indicates that the tolerance range for ALAT is just 15%, for instance, you must use this lower range.
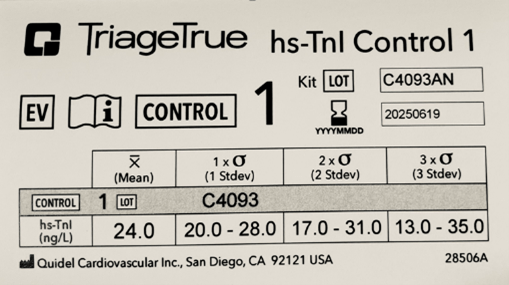 |
Target value 24 ng/L QUALAB range: 24.0 ng/L +/- 24% -> 18.24 - 29.76 ng/L In this case, you must use the QUALAB range. |
4. Select a template that works for your internal QC.
Many medical practice information systems, such as Axenita, will display quality control information in full. You may also use a general template, however, either from the Axonlab Download Center or from another source, such as MQZH.
5. Enter all of the relevant information in the template
- Instrument name
- Analysis
- Control sample (level, if applicable)
- Lot No. of the control/reagent
- Tolerance
- Target value
- Units
- Standard deviation
6. Calculate the standard deviation (sigma intervals)
For the purpose of simplification, let’s assume a target value of 100 and a QUALAB tolerance of 10%. The manufacturer’s tolerance is 12%. This means we will use 10% as our tolerance value, and quality control values within a range of 90 to 110 will therefore be acceptable. Now, however, we would also like to know how far the 1s and 2s intervals extend and/or where the 3s interval begins. To do this, we divide our range of 90 to 110 into six equal intervals (three above and three below the target value), yielding an s value of 3.333.
Expressed mathematically: (110 – 90)/6 = 3.333
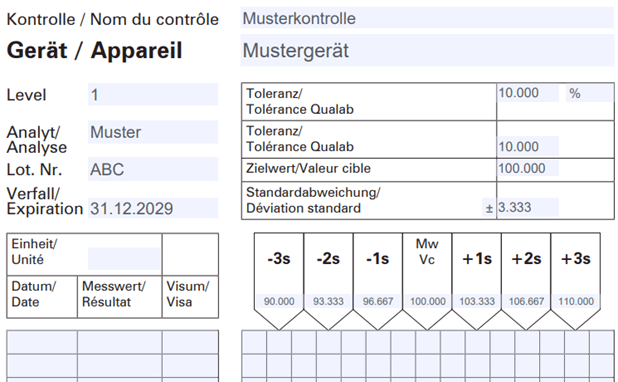
Tip: Many templates, such as the Axonlab template, automatically calculate the standard deviation for you.
You may now save or print out your completed template. Whenever you take internal quality control measurements, you can open this document again, note the date, the test result and your initials, and enter a graphic representation of the test result under the corresponding sigma interval.
Please note that the target value can change with each new lot of reagent or control sample. Never overwrite an old control sample chart – instead, always start over with a fresh chart. Archive completed charts for at least 5 years, as directed in current specifications.
Example: filling out the MQZH template
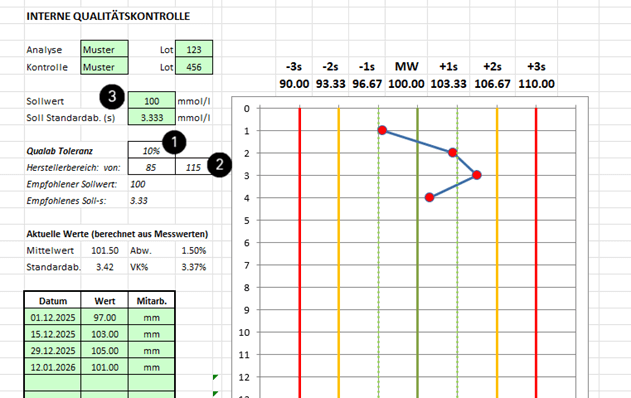
After filling out the designated fields, enter the following values:
- QUALAB tolerance from Appendix A of the current guidelines: 10%
- Manufacturer’s range from either the chart, packaging or information on the instrument display: 85 – 115
--> The recommended standard deviation and target values are now calculated automatically. - Copy the target value and the target standard deviation into the green fields:
Target value: 100 mmol/l
Target standard deviation (sigma interval): 3.333 mmol/l